

Benefits
Specifications
How-to
Contact Us
Learn More

Introducing
•
TRU PULSE
See Everything
as it happens.
Real-time monitoring for production AI. Track performance, detect anomalies, and ensure quality—all from a unified dashboard that shows you what matters.


47%
of AI models in production degrade within 90 days
Source: MLOps Community Survey 2025
6hr
average time to detect model drift without automated monitoring
Source: DataRobot AI Operations Report
$890K
avg cost/ annum of undetected performance degradation
Source: Gartner AI Production Study
85%
reduction in mean-time-to-detection with observability
Solution
A better way to monitor AI
TruPulse provides comprehensive production monitoring built specifically for AI systems. Track what matters, catch problems early, optimize continuously.

Continuous Visibility
Real-time monitoring that never sleeps
TruPulse connects to your application logs and monitors every request. Define custom sampling rates to balance cost and coverage. Track functional metrics, security categories, and health indicators—all updating in real-time.

Unified Dashboard
Everything you need in one place
Performance metrics, quality scores, security posture, cost tracking, and health indicators—all in a single dashboard. No more context-switching between tools. See the complete picture of your AI system at a glance.

Intelligent Alerts
Know about problems before your users do
Set custom thresholds for any metric. Get instant email notifications when quality degrades, costs spike, or security threats emerge. Proactive alerts mean you catch issues early, not after they've impacted thousands of users.
Don’t let production be a blackbox. Integrates with your existing infrastructure and start monitoring in minutes.


AI RISK


REDUCED
01
Blind spots in production
Your AI is live and serving users, but you have no visibility into what it's actually doing. Quality issues, hallucinations, and edge cases slip through undetected.
REDUCED
02
Scattered tools
Performance metrics in one dashboard, quality in another, costs somewhere else. You're constantly context-switching between tools to understand system health.
REDUCED
03
No early warning system
By the time you discover a problem, it's already impacted hundreds of users. You're reactive instead of proactive, always playing catch-up.
REDUCED
04
Runaway costs
Token usage spikes unexpectedly. Expensive prompts drain budgets. You don't know which features or users are driving costs until the bill arrives.
Solution
Three Steps to Monitor your Application
Production monitoring in four simple steps. Go from zero visibility to complete observability in minutes, not months.
1
Connect your logs
Step 1
Seamlessly connect TRU PULSE with your application logs
Flexible Integration Options
Connect your AI application using a lightweight SDK or API to stream logs, prompts, responses, and metadata.
Custom Sampling Controls
Define sampling rates to manage monitoring coverage while optimizing performance and cost.
2
Define your metrics
Step 2
Measure what matters for your AI system.
Functional Performance Metrics
Track accuracy, hallucinations, response quality, latency, and other application-specific metrics.
Security & Safety Monitoring
Configure detection for prompt injection, toxicity, sensitive data exposure, and other security risks.
3
Monitor in real-time
Step 2
Watch your AI system through a unified dashboard
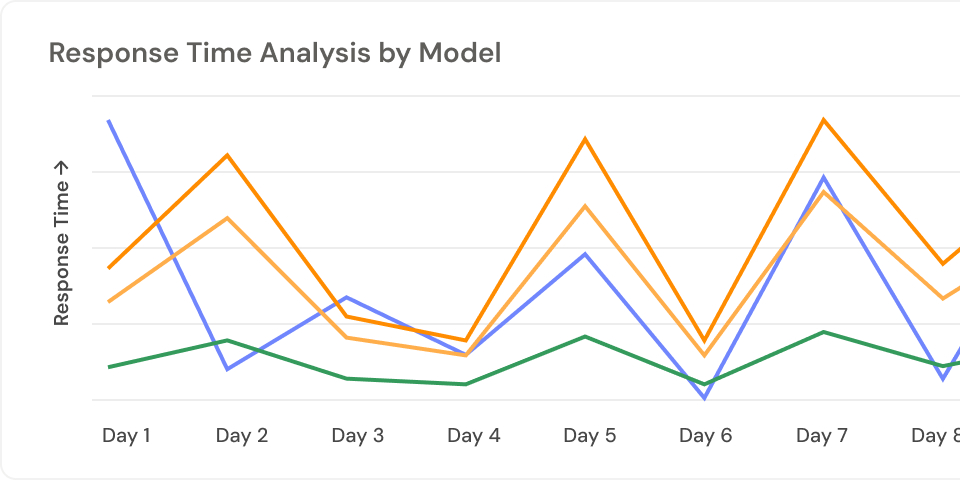
Live AI Observability Dashboards
Track performance trends, safety signals, system health, and operational metrics in real time.
Trace-Level Investigation
Drill into individual interactions to diagnose failures, investigate anomalies, and improve AI performance continuously.

Comprehensive Dashboard
A unified view of your AI system’s performance, safety, and usage metrics, enabling teams to monitor health, detect issues, and make data-driven decisions in real time.

Monitor performance, quality, security signals, and operational metrics across all AI applications in one dashboard.
Track trends in accuracy, hallucinations, safety violations, latency, and system health as they happen.
Operational Visibility
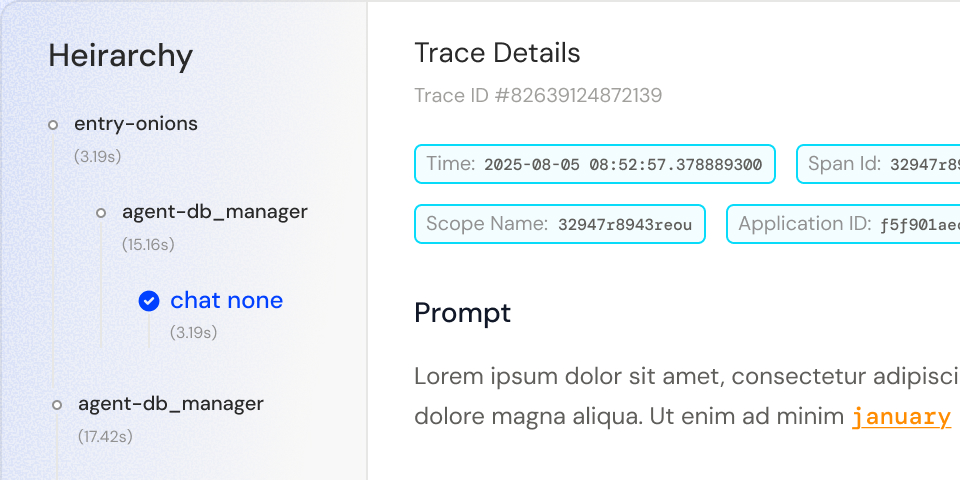
Granular Traces
Detailed step-by-step visibility into every AI interaction, including inputs, outputs, model calls, and intermediate steps for faster debugging and deeper analysis.
View complete traces of prompts, model responses, tool calls, and system metadata for every interaction.
Analyze individual conversations, multi-step reasoning, and agentic flows with full contextual insights
Cost & Token Usage Intelligence
Track token consumption, model usage, and associated costs to optimize AI performance while maintaining budget control.
Identify optimization opportunities
Track API usage, model performance vs. cost, and usage trends across applications.
Monitor token consumption across models, prompts, and users to identify cost drivers.
The Difference
The Trusys Advantage
The gap between teams using structured evaluation and those relying on manual processes is growing every day. Here's the reality.
Health and Functional Monitoring
Capability

Traditional Monitoring

With TRUPULSE
Quality Monitoring

No visibility into hallucinations, accuracy, or output quality

Real-time tracking of functional metrics, hallucination rates, and custom quality measures
Alert System
Generic infrastructure alerts (CPU, memory, latency)
Intelligent alerts on quality degradation, anomalies, and custom thresholds with email notifications
Trace Visibility
Basic request logs without AI context
Granular traces with full request lifecycle, span hierarchies, evaluation results, and metadata
Cost Tracking
Monthly bills with no granular breakdown
Real-time token consumption, per-request costs, expensive prompt identification
Security Monitoring
No awareness of prompt injection, jailbreaks, or toxic content
Continuous security category monitoring with immediate alerts on threats
Data Integration
Requires custom logging instrumentation
Seamless log connection with configurable sampling rates
Dashboard
Subjective Infrastructure metrics only"looks good" assessments
Unified dashboard: performance, quality, security, costs, and health metrics in one place
The choice is clear
TRU PULSE gives you what traditional APM can't: visibility into AI quality, behavior, and business impact—not just infrastructure health.
10x
Faster to market
93%
Fewer incidents
100%
Audit ready
Trust & Security
Built for Enterprise Security Standard
Your AI evaluation infrastructure needs to be as secure and compliant as your production systems. TruEval is built with enterprise requirements in mind.

Enterprise-Grade Security
SOC 2 Type II certified. Your evaluation data is encrypted at rest and in transit.

Data Privacy First
Your prompts, datasets, and results stay in your environment. We never train on your data.

Global Compliance
GDPR, HIPAA, SOC 2 compliant. Built for regulated industries from day one.

Audit-Ready Documentation
Every evaluation is logged and versioned. Generate compliance reports on demand.


Flexible deployment options

Cloud-Hosted
Fully managed SaaS platform. Start evaluating in minutes.

On-Premise
Self-hosted in your data center. Maximum security and compliance.
Stop guessing.
Start measuring.
iGet complete visibility into your production AI. Monitor quality, track costs, detect anomalies, and ship with confidence.
Questions about TRU PULSE?
Our team is here to help. Schedule a personalized demo to see how TRU PULSE fits your specific use case.
Book a Demo

Ready to dive in?
Check out our documentation and tutorials. Get started with example datasets and evaluation templates.
Start Free Trial
Zero
infrastructure changes required
105Min
To first monitoring request
100%
visibility into your AI

Introducing
•
TRU PULSE
See Everything
as it happens.
Real-time monitoring for production AI. Track performance, detect anomalies, and ensure quality—all from a unified dashboard that shows you what matters.
47%
of AI models in production degrade within 90 days
Source: MLOps Community Survey 2025
6hr
average time to detect model drift without automated monitoring
Source: DataRobot AI Operations Report
$890K
avg cost/ annum of undetected performance degradation
Source: Gartner AI Production Study
85%
reduction in mean-time-to-detection with observability
Solution
A better way to monitor AI
TruPulse provides comprehensive production monitoring built specifically for AI systems. Track what matters, catch problems early, optimize continuously.
Continuous Visibility
Real-time monitoring that never sleeps
TruPulse connects to your application logs and monitors every request. Define custom sampling rates to balance cost and coverage. Track functional metrics, security categories, and health indicators—all updating in real-time.
Unified Dashboard
Everything you need in one place
Performance metrics, quality scores, security posture, cost tracking, and health indicators—all in a single dashboard. No more context-switching between tools. See the complete picture of your AI system at a glance.
Intelligent Alerts
Know about problems before your users do
Set custom thresholds for any metric. Get instant email notifications when quality degrades, costs spike, or security threats emerge. Proactive alerts mean you catch issues early, not after they've impacted thousands of users.
Don’t let production be a blackbox. Integrates with your existing infrastructure and start monitoring in minutes.
AI RISK
REDUCED
01
Blind spots in production
Your AI is live and serving users, but you have no visibility into what it's actually doing. Quality issues, hallucinations, and edge cases slip through undetected.
REDUCED
02
Scattered tools
Performance metrics in one dashboard, quality in another, costs somewhere else. You're constantly context-switching between tools to understand system health.
REDUCED
03
No early warning system
By the time you discover a problem, it's already impacted hundreds of users. You're reactive instead of proactive, always playing catch-up.
REDUCED
04
Runaway costs
Token usage spikes unexpectedly. Expensive prompts drain budgets. You don't know which features or users are driving costs until the bill arrives.
Solution
Three Steps to Monitor your Application
Production monitoring in four simple steps. Go from zero visibility to complete observability in minutes, not months.
1
Connect your logs
Step 1
Seamlessly connect TRU PULSE with your application logs
Flexible Integration Options
Connect your AI application using a lightweight SDK or API to stream logs, prompts, responses, and metadata.
Custom Sampling Controls
Define sampling rates to manage monitoring coverage while optimizing performance and cost.
2
Define your metrics
Step 2
Measure what matters for your AI system.
Functional Performance Metrics
Track accuracy, hallucinations, response quality, latency, and other application-specific metrics.
Security & Safety Monitoring
Configure detection for prompt injection, toxicity, sensitive data exposure, and other security risks.
3
Monitor in real-time
Step 2
Watch your AI system through a unified dashboard
Live AI Observability Dashboards
Track performance trends, safety signals, system health, and operational metrics in real time.
Trace-Level Investigation
Drill into individual interactions to diagnose failures, investigate anomalies, and improve AI performance continuously.

Comprehensive Dashboard
A unified view of your AI system’s performance, safety, and usage metrics, enabling teams to monitor health, detect issues, and make data-driven decisions in real time.
Monitor performance, quality, security signals, and operational metrics across all AI applications in one dashboard.
Track trends in accuracy, hallucinations, safety violations, latency, and system health as they happen.
Operational Visibility
Granular Traces
Detailed step-by-step visibility into every AI interaction, including inputs, outputs, model calls, and intermediate steps for faster debugging and deeper analysis.
View complete traces of prompts, model responses, tool calls, and system metadata for every interaction.
Analyze individual conversations, multi-step reasoning, and agentic flows with full contextual insights
Cost & Token Usage Intelligence
Track token consumption, model usage, and associated costs to optimize AI performance while maintaining budget control.
Identify optimization opportunities
Track API usage, model performance vs. cost, and usage trends across applications.
Monitor token consumption across models, prompts, and users to identify cost drivers.
The Difference
The Trusys Advantage
The gap between teams using structured evaluation and those relying on manual processes is growing every day. Here's the reality.
Health and Functional Monitoring
Capability
Traditional Monitoring
With TRUPULSE
Quality Monitoring
No visibility into hallucinations, accuracy, or output quality
Real-time tracking of functional metrics, hallucination rates, and custom quality measures
Alert System
Generic infrastructure alerts (CPU, memory, latency)
Intelligent alerts on quality degradation, anomalies, and custom thresholds with email notifications
Trace Visibility
Basic request logs without AI context
Granular traces with full request lifecycle, span hierarchies, evaluation results, and metadata
Cost Tracking
Monthly bills with no granular breakdown
Real-time token consumption, per-request costs, expensive prompt identification
Security Monitoring
No awareness of prompt injection, jailbreaks, or toxic content
Continuous security category monitoring with immediate alerts on threats
Data Integration
Requires custom logging instrumentation
Seamless log connection with configurable sampling rates
Dashboard
Subjective Infrastructure metrics only"looks good" assessments
Unified dashboard: performance, quality, security, costs, and health metrics in one place
The choice is clear
TRU PULSE gives you what traditional APM can't: visibility into AI quality, behavior, and business impact—not just infrastructure health.
10x
Faster to market
93%
Fewer incidents
100%
Audit ready
Trust & Security
Built for Enterprise Security Standard
Your AI evaluation infrastructure needs to be as secure and compliant as your production systems. TruEval is built with enterprise requirements in mind.
Enterprise-Grade Security
SOC 2 Type II certified. Your evaluation data is encrypted at rest and in transit.
Data Privacy First
Your prompts, datasets, and results stay in your environment. We never train on your data.
Global Compliance
GDPR, HIPAA, SOC 2 compliant. Built for regulated industries from day one.
Audit-Ready Documentation
Every evaluation is logged and versioned. Generate compliance reports on demand.
Flexible deployment options
Cloud-Hosted
Fully managed SaaS platform. Start evaluating in minutes.
On-Premise
Self-hosted in your data center. Maximum security and compliance.
Stop guessing.
Start measuring.
iGet complete visibility into your production AI. Monitor quality, track costs, detect anomalies, and ship with confidence.
Questions about TRU PULSE?
Our team is here to help. Schedule a personalized demo to see how TRU PULSE fits your specific use case.
Book a Demo
Ready to dive in?
Check out our documentation and tutorials. Get started with example datasets and evaluation templates.
Start Free Trial
Zero
infrastructure changes required
105Min
To first monitoring request
100%
visibility into your AI